Restaurant Sales & Menu Insights-SQL Analysis Project
📌 Project Overview
This project is based on a guided case study by Maven Analytics. I completed the SQL analysis independently using a provided dataset and business questions, simulating real-world restaurant analytics.
I am working with two tables that I’ll look at separately and then combined in objective 3.
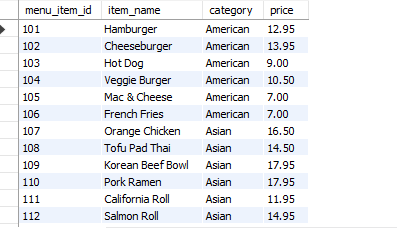
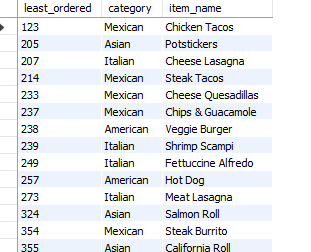
Here you can see a snippet of the menu_items table.
Tools used: MySQL
Objective: To explore a restaurant’s sales and menu data to uncover insights about customer behavior, menu pricing, and order trends.
🎯 Objective 1: Explore the Menu
The first objective is to better understand the items at the restaurant such as the most and least expensive, each category, and more.
✅ How many items are on the menu?
SELECT *
FROM menu_items;
Insight:
There are 32 menu items available, offering a diverse but manageable selection.
✅ What are the least and most expensive items on the menu?
SELECT MIN(price)
FROM menu_items;
SELECT MAX(price)
FROM menu_items;
Insight:
The cheapest item is $5.00
The most expensive item is $19.95
✅ How many Italian dishes are on the menu?
SELECT COUNT(menu_item_id)
FROM menu_items
WHERE category = ‘Italian’;
Insight:
There are 9 Italian dishes, making it a major category on the menu.
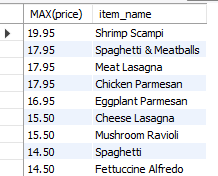
✅ Least and most expensive Italian dishes?
SELECT MAX(price), item_name
FROM menu_items
WHERE category = ‘Italian’
GROUP BY item_name
ORDER BY MAX(price) DESC;
Insight:
Least expensive Italian dish is $14.50
Most expensive Italian dish is $19.95
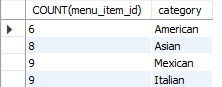
✅ How many dishes are in each category?
SELECT COUNT(menu_item_id), category
FROM menu_items
GROUP BY category;
Insight:
You can see a nice variety of various categories for customers to choose from. For so many categories though it might lead to decision fatigue for customers.
📦 Objective 2: Explore the Orders
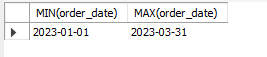
✅ What is the date range of the order data?
SELECT MIN(order_date), MAX(order_date)
FROM order_details;
The data spans from: 1/1/2023 to 3/31/2023.
✅ How many orders and items were made in this period?
SELECT DISTINCT COUNT(order_id)
FROM order_details;
SELECT DISTINCT COUNT(item_id)
FROM order_details;
Insight:
Over the date range there were 12234 orders and 12097 items ordered.
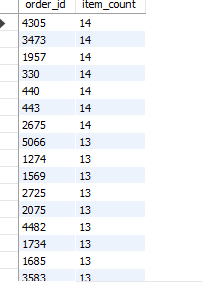
✅ Which orders had the most items?
SELECT order_id, COUNT(item_id) AS item_count
FROM order_details
GROUP BY order_id
ORDER BY item_count DESC;
Insight:
Some orders had a maximum of 14 items. These largest order amounts might indicate a group event or big table.
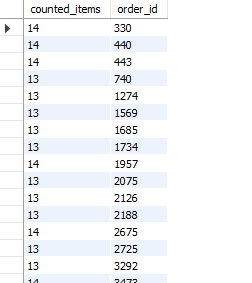
✅ How many orders had more than 12 items?
SELECT COUNT(order_details_id) as counted_items, order_id
FROM order_details
GROUP BY order_id
HAVING counted_items > 12;
Insight:
These orders exceeded 12 items, which could mean they’re high-value customers or large parties.
🧠 Objective 3: Analyze Customer Behavior
✅ Join menu items with orders
CREATE TABLE restaurant_name
SELECT *
FROM menu_items
JOIN order_details
ON menu_item_id = item_id;
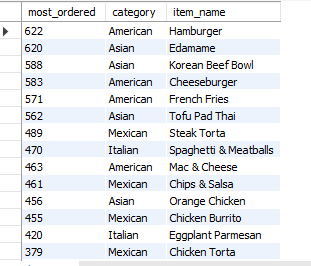
✅ What were the most and least ordered items?
SELECT COUNT(order_details_id) AS least_ordered, category, item_name
FROM restaurant_name
GROUP BY category, item_name
ORDER BY least_ordered ASC;
SELECT COUNT(order_details_id) AS most_ordered, category, item_name
FROM restaurant_name
GROUP BY category, item_name
ORDER BY most_ordered DESC;
Insight:
Most popular item: Hamburger
Least popular item: Chicken Tacos
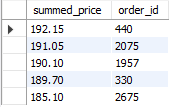
✅ What are the top 5 highest-spend orders?
SELECT SUM(price) AS summed_price, order_id
FROM restaurant_name
GROUP BY order_id
ORDER BY summed_price DESC
LIMIT 5;
Insight:
These top spenders could mean large group orders or premium customers.
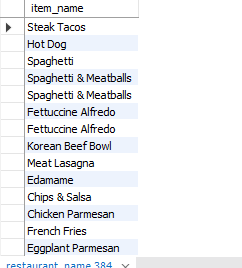
✅ View the details of the highest spend order. Which specific items were purchased?
SELECT item_name
FROM restaurant_name
WHERE order_id = 440;
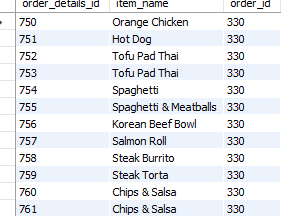
✅ BONUS: View the details of the top 5 highest spend orders
SELECT order_details_id, item_name, order_id
FROM restaurant_name
WHERE order_id IN
( SELECT top_orders.order_id
FROM (
SELECT order_id
FROM restaurant_name
GROUP BY order_id
ORDER BY SUM(price) DESC
LIMIT 5)
AS top_orders);
Insight: This shows what items drove the highest spend orders and can give us further insights into what items to promote.
✅ Final Recommendations & Business Insights
Based on the analysis:
- Highlight Top Performers: Promote or bundle the most frequently ordered items and top categories to increase sales.
- Review Low-Performing Items: Consider revising or removing the least popular items to optimize the menu. This will also help to avoid decision fatigue for customers.
- Upsell During High-Spend Orders: Leverage the top spend order patterns to suggest premium add-ons for large orders or catering to increase sales.
- Target Italian Cuisine Fans: Italian dishes are both plentiful and popular — offer specials or limited-time combos for these dishes.
- Plan Inventory Around Volume Peaks: Orders with more than 12 items may indicate events — I recommend further analysis of their timing to ensure proper staffing and supply levels.
- Monitor Pricing Strategy: I encourage you to use category-wise average prices to ensure competitiveness and profitability without compromising on value.