
In this project, I analyzed student engagement data across two different time periods and subscription types (free vs. paid plans) using Excel. The goal was to determine confidence intervals and perform hypothesis testing to evaluate engagement trends over time.
The main focus was on paid vs. free subscriber watch time for 365 Data Science. This includes people located in both the U.S. and India. The content is broken down into quarters and years.
Free:
Q4 2021 + Q4 2022
Paid:
Q4 2021 + 2022
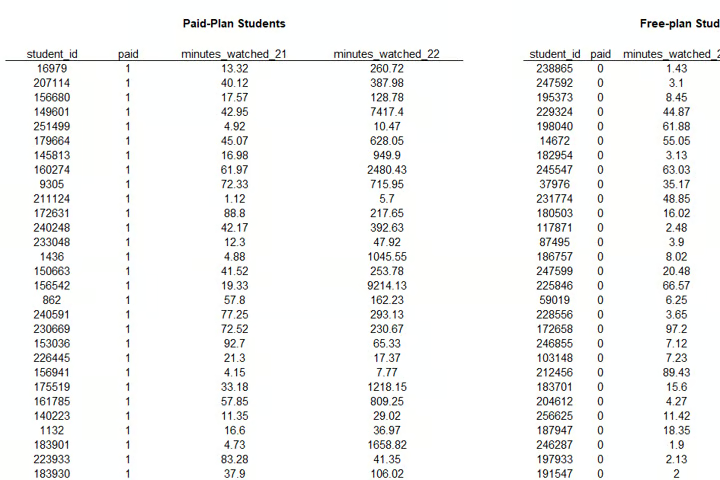
Here’s a sample of some of the data:
I decided it was a good idea to do a comparison of the mean, skew, median, and more. Excel has excellent built-in functions for these purposes!
As I was studying the data, I found that the average watch time for free members in 2022 was much higher than in 2021. In 2021, the average watch time was about 25.39 minutes whereas in 2022 it was 117.64 minutes.
Paid had similar results as far as an increase. In 2021, the average was about 33.80 minutes whereas in 2022 it was about 273.
Here are some of the built-in functions I used:
- =AVERAGE()
- =STDEV.S()
- =COUNT()
- =SQRT()
- =KURT()
The null hypothesis:
Engagement in 2021 ≥ Engagement in 2022.
I also used the Data Analysis Toolpak for t-tests. This is an excellent feature in Excel since you can choose unequal or equal variances. In my case, I had a 95% confidence interval and ran sample tests assuming unequal variances.
Paid Plan
Mean: Mean increased from Q4 2021 to Q4 2022 for paid plan students. It went from 33.80 minutes to approximately 273.02 minutes. There’s an increase in engagement during this time.
Median: The median increased from 2021 to 2022 in Q4. It went from 26.33 to 40.28 minutes. While not extreme, it does show that engagement increased.
Standard Deviation: The standard deviation increased as well. It went from 28.21 minutes in Q4 2021 to 854.58 minutes in Q4 2022. This could be due to a range such as some students watching a large amount of content and others not so much.
Findings: Students who began as low engagement in 2021 tended to increase in 2022. It’s important to keep the standard deviation in mind since it shows a variance for overall engagement.
Free Plan
Mean: The mean increased from 25.39 minutes in Q4 2021 to about 117.64 in Q 2022. This shows that engagement increased during this time. The engagement is lower than what’s seen for paid students though.
Median: The median engagement decreased from 14.17 to 11.83 in 2021 to 2022. This could mean that overall engagement decreased but the mean is higher due to a few students driving up the overall engagement.
Standard Deviation: Standard deviation increased from 26.23 minutes to 468.93 minutes in 2021 to 2022 Q4.
Findings: While the mean increased the median did not. This leads to the highly likely scenario of engagement not increasing.
A good strategy would be to target students in this group to boost engagement.
Paid vs Free
Paid overall have increased their engagement much more than free students. A potential is that since students are paying for said service they want to get the full benefit of what they’re paying for.
Free Plan Skewness
The skewness increased from 1.17 in 2021 to 15.06 in 2022.
Paid Plan Skewness
The skewness increased from .63 to 7.07.
The data represents a positive right skew.
Kurtosis went from .36 in 2021 to 315.76 in 2022 for free students. For paid, it increased from -.85 to 58.48 from 2021 and 2022.
An increase in skewness and kurtosis points to a larger number of students watching more content than most.
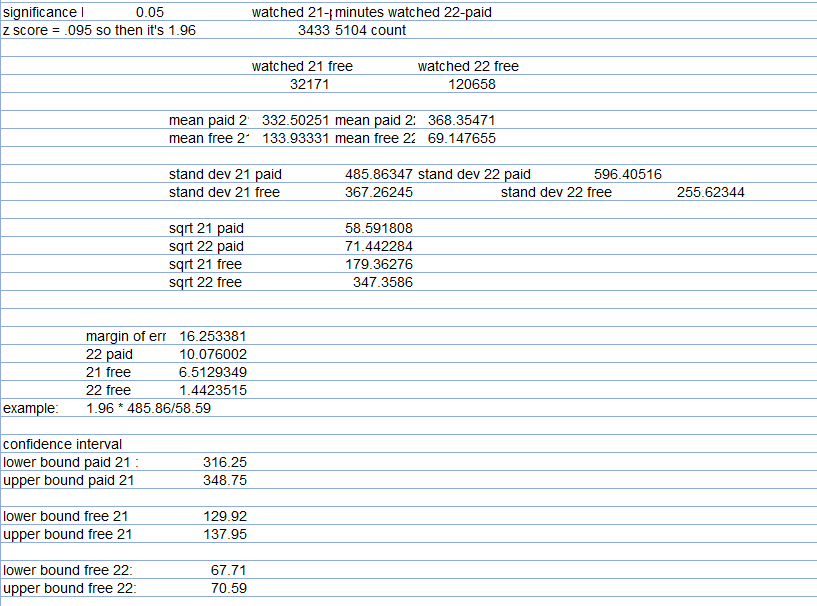
Free vs Paid Confidence
Free: You can see a decrease in engagement for Q4 2021 to 2022. Average minutes watched went from 129.92 to 137.95 and 67.71 to 70.59.
Paid: There’s an increase for engagement. The increase for minutes watched went from 316.25 to 348.76 and then 351.91 to 384.72 minutes.
T-Test Conclusions
Free Students
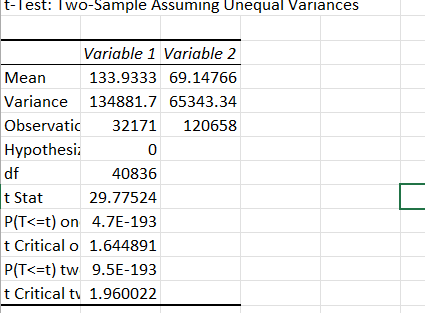
We can’t reject the null hypothesis because the t-statistic is greater than the critical value. The critical value is -1.645 with the t stat being 29.78.
Paid Students
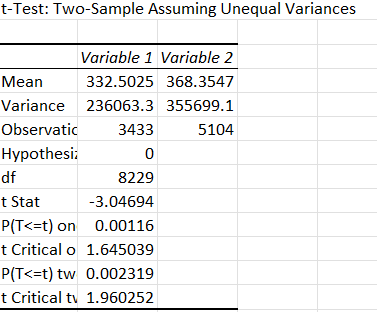
We reject the null hypothesis because the t-statistic is lower than the critical value (-3.05 compared to 1.96).
Recommendations: Since the end goal is to increase engagement overall and those paying for the site, it’s recommended to focus on free plans. While free plans are lower engagement, it’s a good idea to focus on building these up.
Once done, offer promotions and various coupons for the free students. A great example would be for them to try premium for 1 month. After the 1 month is up then they’ll be charged. Let them know they can cancel at any time and it’s only available for a limited time.
Thank you for reading this analysis. Excel is not my first analysis tool, but I’ve grown comfortable with it.
I also enjoy Python, R, Tableau, and machine learning packages!
All work completed is my own.
Data in thanks to 365 data science.